


I manage a learning and development team. Part of my role is to sit with people for feedback conversations, look back together at a full period of work, and put both what is working and what needs improvement on the table. A process like this requires a lot of courage, zero judgment, and reflection on my own performance and how it affected the team’s results. And, of course, as an employee, I also have a performance review with my manager and receive feedback on what to improve and what to preserve.
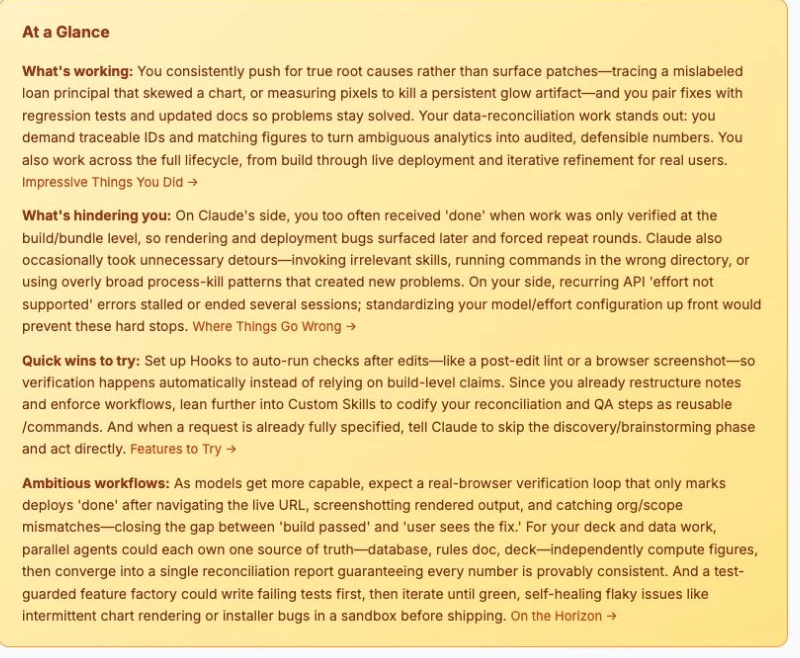
This time, I asked Claude Code to give me a performance review. I ran the /insights command and received a full report on how I use Claude Code and how I can improve.
It was not a general score or a flattering summary of our conversations. I received an HTML report that connected dozens of sessions, identified recurring patterns, and cited specific examples. It also included a section called “Where Things Go Wrong,” which made me sink into my chair a little.
Think of it as a fitness tracker for working with AI. It does not settle for the feeling that you were productive. It shows what you actually did, where you stopped, and what happened often enough to become a pattern.
What does the /insights command do?
According to the official documentation, /insights generates a report that analyzes your Claude Code sessions and presents your project areas, interaction patterns, and friction points. In practice, the report I received went well beyond counting messages.
It tried to understand what I wanted to achieve in each session, what was completed, where Claude was especially helpful, and what caused the work to stall or require another round. It then connected those cases and suggested actions that could become rules in CLAUDE.md, skills, or verification processes.
That is the important distinction: the report does not only say how much you used Claude Code. It examines your shared working method with the tool.
What is stored, and what to know before you run it
By default, Claude Code stores local session transcripts under ~/.claude/projects/. The documentation says that these files are stored as plaintext and that anything passed through a tool, including the contents of a file that was read or the output of a command, may appear in a transcript.
That is why I do not assume that /insights sees “metadata only.” Before running it in a sensitive work environment, learn the retention policy for your account type, check cleanupPeriodDays, and understand what is stored locally. The report is highly useful, but usefulness is not a substitute for an information policy.
What the report discovered about me
The pleasant part first: what I do well
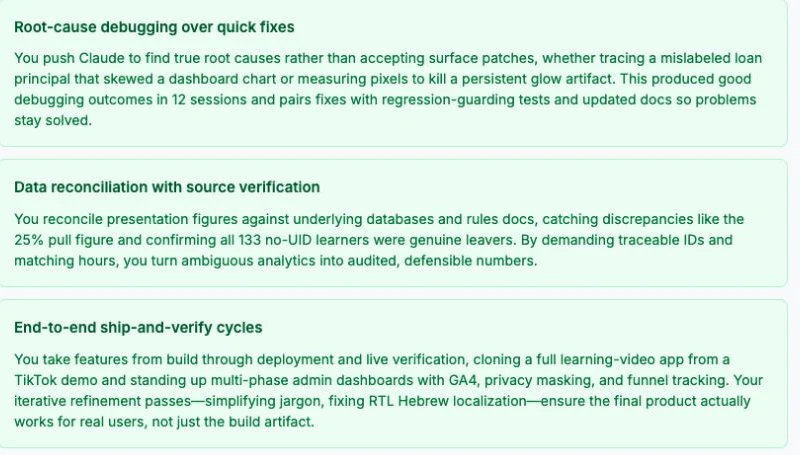
The report identified three patterns that appeared across different sessions.
Chasing the root cause
I do not give up on the question “why did this happen?” even when a quick patch is available. The report found 12 sessions with good debugging outcomes, including one where we measured pixels to eliminate a stubborn glow effect.
Reconciling data with the source
In presentations and dashboards, I demanded identifiers, hours, and a match with the underlying database. The report called the result “audited, defensible numbers”: figures I could explain and stand behind.
Working across the entire lifecycle
I do not want to stop at the code. I want to reach deployment, verify the result, and refine it for real users. That was my intention; in a moment, you will see where the execution did not always live up to it.
Now for the parts that were less pleasant to read
The greatest source of friction was the gap between “the task is finished” and “the result actually works.”
The report classified 19 friction instances as Buggy Code. That does not mean I received the exact same bug in 19 separate sessions; it means this category appeared 19 times in the data. In the clearest examples, the build passed and the code-level check looked correct, but the problem remained in the real browser.
In another case, a deployment script reported success while the live site had not updated at all. The deployment ran against the wrong Vercel scope. On paper everything was green; users still saw the old version.
Partial verification and premature success reports
A build or bundle check replaced a test of the real interface, so fixes that looked perfect in code failed during rendering.
A model and effort setting that blocked sessions
An unsupported combination of effort level and thinking mode caused API errors. Several sessions stopped before the work even began.
Commands that were too broad for a parallel environment
A broad `pkill` command from one session stopped another session’s server. The report described it as “accidentally assassinated,” which was dramatic but fairly accurate.
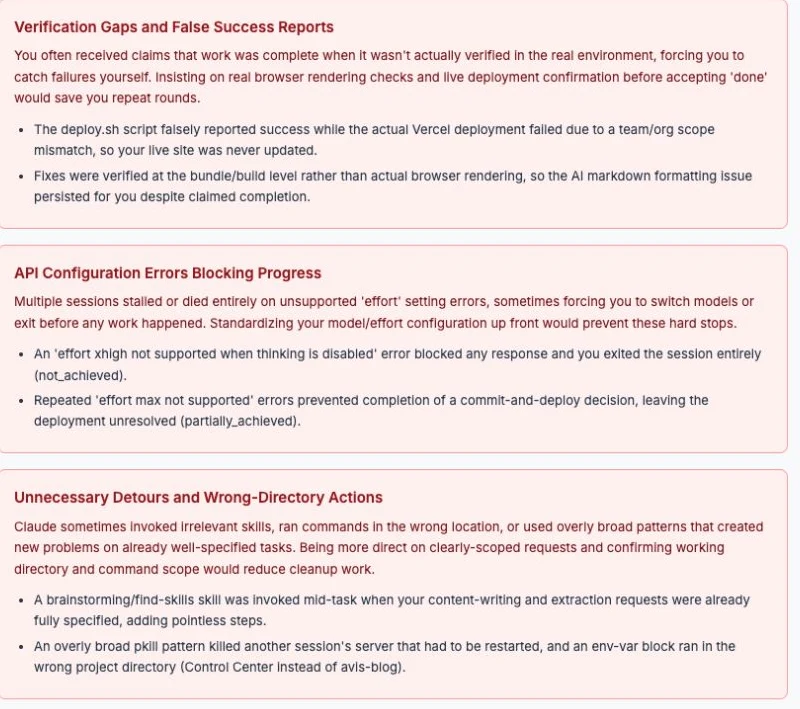
The most interesting point was the contradiction: the report identified that I tend to close the loop all the way to the live site, while also showing that this verification was not consistent enough. That is precisely why a report like this is useful. A strength that does not become a working rule can remain nothing more than a good intention.
What I did with the recommendations that same day
A performance review that does not change behavior is just an attractive document. I therefore turned the recommendations into four changes to the system.
Verification rules in CLAUDE.md
A frontend fix is complete only after a browser check. A deployment is complete only when the live URL displays the change.
A stronger deployment-verification skill
I added a check of the account and scope before deployment, followed by explicit verification of the change on the live site.
A corrected thinking setting
I changed the setting that created the conflict between effort and thinking so that sessions would no longer die before the first request.
A process-safety rule
Stop a process only by its exact port or PID. Do not use a broad `pkill` that could affect parallel sessions.
Notice the common thread: every fix is a change to the system. Not “I will try to remember,” but a written rule, setting, skill, or permanent step in the process.
That is also the principle behind skills for AI agents: if you want an agent to perform an action repeatedly at the same standard, do not leave it as a random note in a chat. Turn it into a repeatable instruction that can be checked.
Why this matters even if you are not a developer
I come from organizational learning, and to me this report teaches something broader than Claude Code.
We are all building ways of working with AI. Some of us learn through trial and error, some through imitation, and many rely on intuition: “it feels like this is helping” or “I think I have become more efficient.”
The problem is that a good feeling does not show where the work broke. The report showed me that I thought I was finishing tasks more completely than the data suggested. It also showed that the problem was not only the model’s capability, but also my settings, permissions, verification processes, and instructions.
That is the practical meaning of Agentic Engineering: do not only choose a good model. Build a system around it that defines what counts as success, which tools are used, and how you know the result is real.
Other Claude Code commands worth knowing
/insights looks at patterns across sessions. The following commands help manage the current session and catch problems earlier.
/doctor- When something in the environment is not working. Diagnoses Claude Code installation and configuration issues. I run it when I see unusual behavior before I begin changing the project.
/context- When the conversation grows long. Shows what is consuming the context window. It complements [my guide to managing the context window](/en/blog/manage-claude-code-context-window/) and turns the problem into data you can act on.
/usage- When you want to understand your usage limits. Shows five-hour and weekly usage so you can decide whether to continue with the same model or change the way you work.
/compact- When you need to free space without losing the thread. You can add instructions about what the summary should preserve, such as design decisions and open bugs.
/rewind- When a major direction has gone wrong. Returns the code or conversation to an earlier checkpoint instead of repeatedly repairing a change that was wrong from the start.
/memory- When the same comment keeps recurring. Opens memory-file and auto-memory management. If I have given the same instruction three times, it probably deserves to become a permanent rule.
/review- Before publishing a significant change. Performs a focused review of the changes. Claude Code also provides
/security-reviewfor security vulnerabilities.
You do not need to remember all of them. Start with /insights, and let the report show which part of your working method needs another tool.
Frequently asked questions about Claude Code Insights
What is Claude Code Insights?
Claude Code Insights is a personal report generated with the /insights command. It summarizes patterns across sessions, surfaces strengths and friction points, and suggests actions that can improve the way you work with Claude Code.
Does /insights replace manual verification?
No. The report identifies patterns and cases worth examining, but it does not prove that a fix works in the browser or that a deployment reached the live site. You still need to verify the result with the tools and environment your users encounter.
What should you do with the report’s recommendations?
Choose the recommendations that appeared in more than one case and turn them into a change you can verify: a rule in CLAUDE.md, a skill, a setting, or a permanent verification step. The goal is to change the system, not merely remember to do better next time.
The bottom line: now it is your turn
If you work with Claude Code regularly, try this short process this week:
I am still learning the right way to work with these tools. One thing is already clear: anyone who works with AI every day needs to stop occasionally and examine not only what they built, but how they and the AI got there.
I would love to hear what the report discovered about you, especially the parts it suggested improving.
Related Resources
- Claude Code Commands: the official documentation for
/insightsand the other built-in commands. - Claude Code Data Usage: usage and retention policy by account type.
- Explore the .claude directory: what is stored locally, for how long, and how to change the cleanup period.